> ## Documentation Index
> Fetch the complete documentation index at: https://devzone.nayax.com/llms.txt
> Use this file to discover all available pages before exploring further.
# SDK Log Generation
Logging shows you what the SDK is doing and how it's communicating with the peripheral. It's the main tool Nayax uses to diagnose issues in both the SDK's own behavior and its connection to the peripheral.
## Configuration
To generate SDK logs, configure two flags in the `main` method. `debug` is a boolean that turns log generation on or off. `dump_packets_level`, in `vmc_configuration`, sets how much detail the SDK logs:
| Value | What it logs |
| - | - |
| `debug_level_dump_none` | Nothing. No log is generated. |
| `debug_level_dump_all` | Every message. |
| `debug_level_dump_moderate` | Every message except keep-alives and their ACKs. |
The example below sets both flags together.
```java Java theme={null}
public static void main(String[] args) {
vmc_config.dump_packets_level = vmc_configuration.debug_level_dump_moderate;
vmc_config.debug = true;
}
```
```csharp C# theme={null}
public class vend_machine
{
public static void Main(string[] args)
{
vmc_config.debug = true;
vmc_config.dump_packets_level = vmc_configuration.debug_level_dump_moderate;
}
}
```
```c C theme={null}
vmc_init()
config.dump_packets_level = debug_level_dump_none;
```
## Log file location
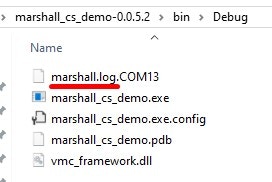
Where the SDK writes its log file depends on which SDK you use:
* On the **C# SDK**, logs save automatically to the `bin\Debug` folder in the directory you run the SDK from. For example:
 * On the **C SDK**, you set the log location by invoking the function below.
```c C theme={null}
printk_register_puts(terminal_tx_str);
```
The SDK sends its log output to whatever board or console you configure. It's up to you to decide where to write it:
* Command line, as in the x86/Linux example below.
* A UART port, as in the STM example below.
* Any other destination you choose.
```c C theme={null}
static void terminal_tx_str(char *str)
{
#if defined(__PLATFORM_X86) || defined(__PLATFORM_LINUX)
printf("%s", str);
#elif defined(__PLATFORM_STM32)
drv_usart_tx_data(&terminal_usart, (uint8_t*)str, strlen(str));
#endif
}
```
The C SDK's demo app generates the log to the command line by default.
* On the **Java SDK**, you set the default log file path in the `FileWriter` initialization, as shown below:
```java Java theme={null}
if (vmc_config.debug) {
BufferedWriter out = null;
try {
FileWriter fstream = new FileWriter("c:\\out.txt", true); // true to append data
out = new BufferedWriter(fstream);
Log.initialize(out);
} catch (Exception ex) {
// Handle exception
}
}
```
In the example above, the log file is created at the root of the `C:` drive as `out.txt`. The `true` parameter in the `FileWriter` constructor appends new data to an existing log file instead of overwriting it.
## See also
Once you have a log, run it through this tool to check it against known-good reference traces.
This documentation is built and hosted on [Mintlify](https://mintlify.com), a developer documentation platform.
* On the **C SDK**, you set the log location by invoking the function below.
```c C theme={null}
printk_register_puts(terminal_tx_str);
```
The SDK sends its log output to whatever board or console you configure. It's up to you to decide where to write it:
* Command line, as in the x86/Linux example below.
* A UART port, as in the STM example below.
* Any other destination you choose.
```c C theme={null}
static void terminal_tx_str(char *str)
{
#if defined(__PLATFORM_X86) || defined(__PLATFORM_LINUX)
printf("%s", str);
#elif defined(__PLATFORM_STM32)
drv_usart_tx_data(&terminal_usart, (uint8_t*)str, strlen(str));
#endif
}
```
The C SDK's demo app generates the log to the command line by default.
* On the **Java SDK**, you set the default log file path in the `FileWriter` initialization, as shown below:
```java Java theme={null}
if (vmc_config.debug) {
BufferedWriter out = null;
try {
FileWriter fstream = new FileWriter("c:\\out.txt", true); // true to append data
out = new BufferedWriter(fstream);
Log.initialize(out);
} catch (Exception ex) {
// Handle exception
}
}
```
In the example above, the log file is created at the root of the `C:` drive as `out.txt`. The `true` parameter in the `FileWriter` constructor appends new data to an existing log file instead of overwriting it.
## See also
Once you have a log, run it through this tool to check it against known-good reference traces.
This documentation is built and hosted on [Mintlify](https://mintlify.com), a developer documentation platform.