> ## Documentation Index
> Fetch the complete documentation index at: https://devzone.nayax.com/llms.txt
> Use this file to discover all available pages before exploring further.
# Reports
To monitor operational performance and financial metrics, such as sales trends and machine health, go to **Reports > Dashboard** in **[Nayax Core](https://qa.nayax.com/core/public/f?model=reports/dashboard)**. This page provides a customizable view of your business through various dashboards and data widgets.
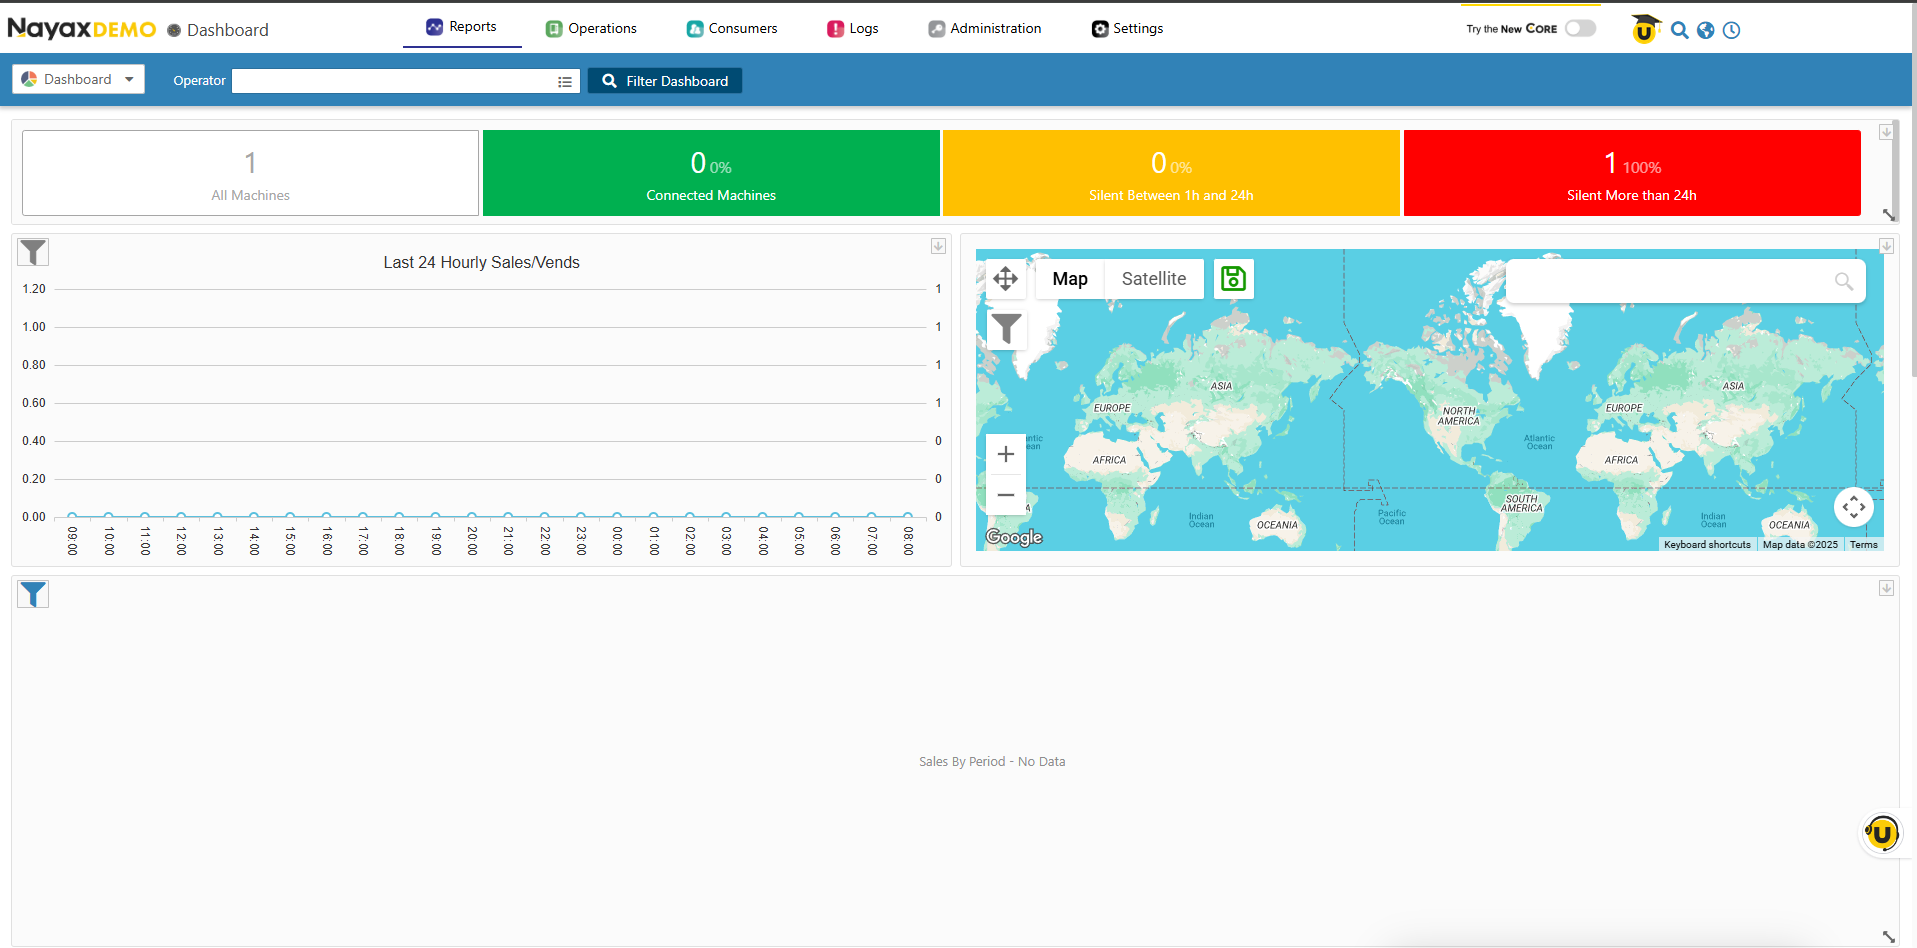 Widgets and dashboards serve two main levels within the Nayax Core platform:
* **Actor (Operator) Level**: It consolidates data from all machines operated by a specific Actor or Operator.
* **Machine Level**: It shows data relevant only to a single machine.
You can also use the Lynx API to retrieve the raw data from these widgets in a structured format (JSON). See [Get Machine Widget Data Using the API](/docs/manage-data-operations/lynx-api/reports/retrieve-machine-widget-data) to learn more.
Widgets and dashboards serve two main levels within the Nayax Core platform:
* **Actor (Operator) Level**: It consolidates data from all machines operated by a specific Actor or Operator.
* **Machine Level**: It shows data relevant only to a single machine.
You can also use the Lynx API to retrieve the raw data from these widgets in a structured format (JSON). See [Get Machine Widget Data Using the API](/docs/manage-data-operations/lynx-api/reports/retrieve-machine-widget-data) to learn more.