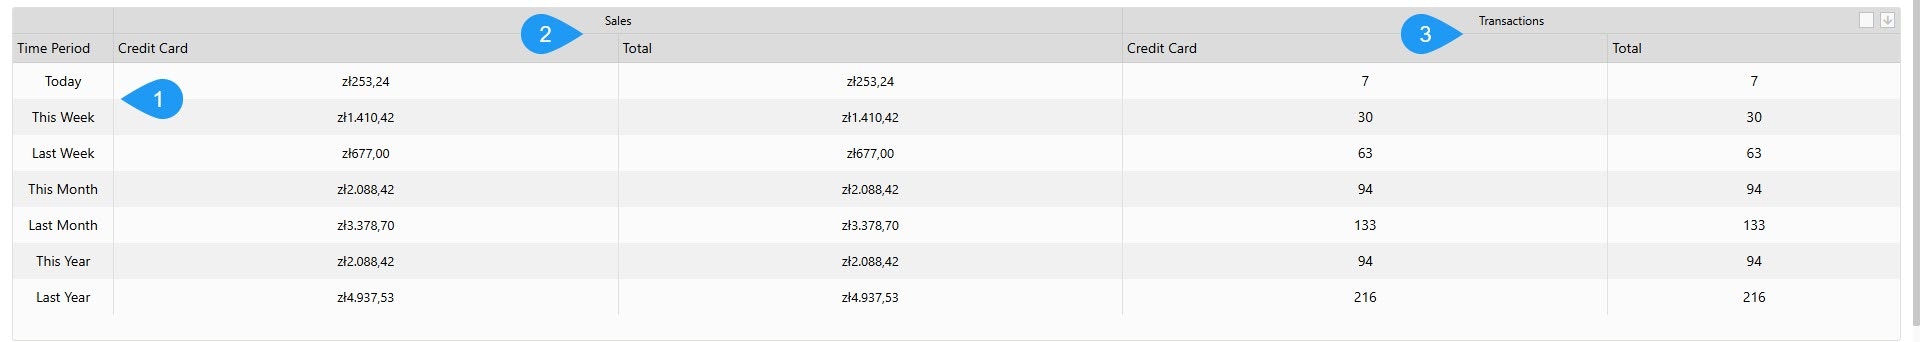
- Time Period: Breaks down data into standard reporting windows: Today, This Week, Last Week, This Month, Last Month, This Year, and Last Year.
- Sales: Shows the monetary value earned, categorized by payment method (e.g., Credit Card) and a total for that period.
- Transactions: Lists the total count of individual vends made, categorized by payment method, and a total for that period.