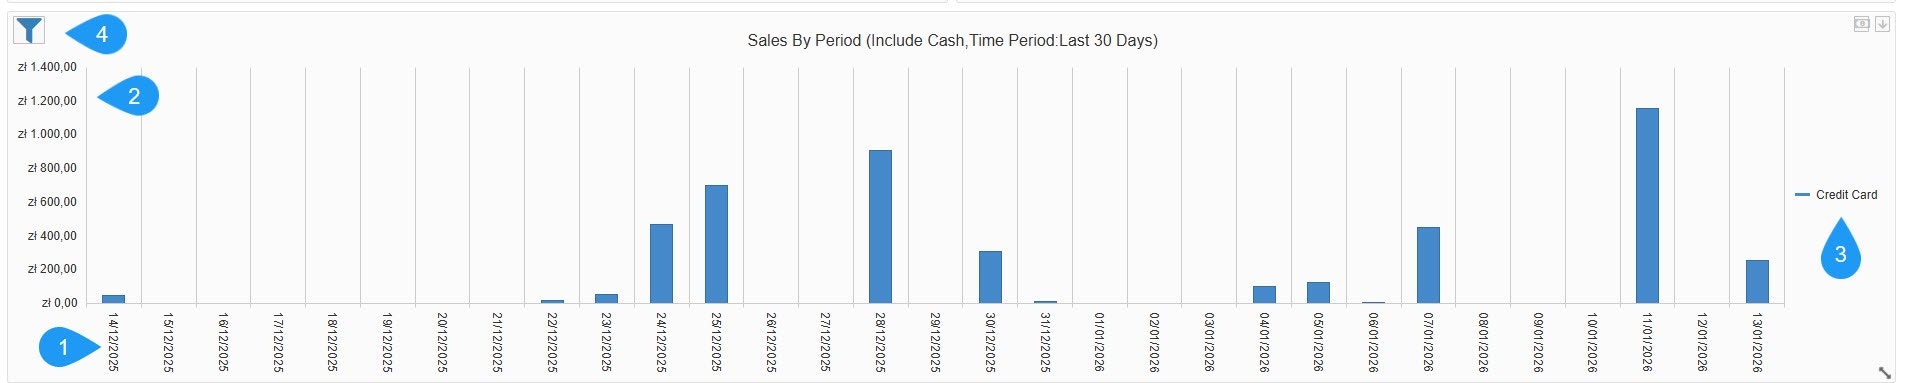
- Time Dimension (X-Axis): Shows a daily breakdown of the selected timeframe, such as the last 30 days.
- Revenue Scale (Y-Axis): Shows the total value of sales in the local currency, such as zł - Polish złoty.
- Legend: Categorizes sales by payment method. In this view, it is tracking Credit Card transactions (indicated by the blue bars).
Filters
Filters
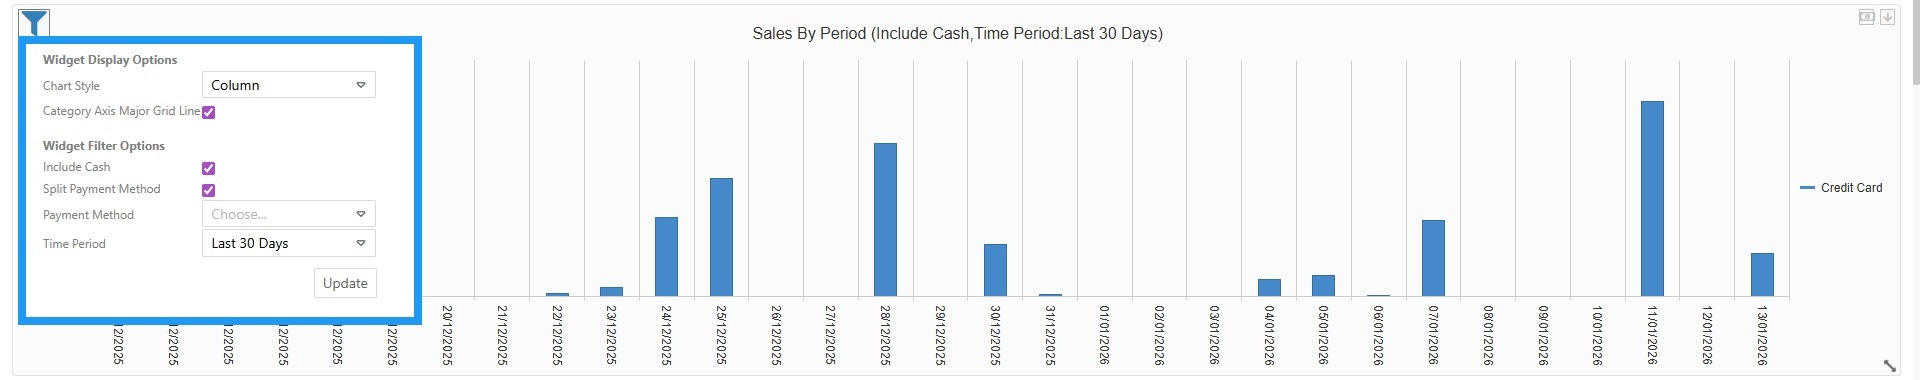
- Chart Style: Choose the data visualization format: column, area, or line.
- Category Axis Major Grid Line: A toggle to show or hide vertical background lines for better readability.
- Include Cash: A checkbox to add or remove physical cash transactions from the totals.
- Split Payment Method: An option to see separate bars/lines for different payment types (Cash vs. Credit Card) rather than one combined total.
- Payment Method: A dropdown to filter the entire widget by a specific provider or type.
- Time Period: Defines the date range for the data, such as Last 30 Days.